

The Strongest-Looking Applicant Isn’t the One Who Funds
July 13, 2026

The Strongest-Looking Applicant Isn’t the One Who Funds
Abstract: The analysis argues that the “best-looking” personal loan applicant is often not the applicant most likely to fund. Based on roughly 500,000 non-bank personal loan applications in Canada from early 2026, the data shows that lenders and marketers should optimize for fundability, not surface-level borrower strength. Applicants who actually convert tend to have steady, verifiable income, direct deposit, fair credit, an active managed debt profile, and a moderate loan request. The core lesson is that lenders fund borrowers they can quickly understand and trust, not necessarily borrowers who appear wealthiest or most creditworthy on paper.
A first-party read of roughly 500,000 non-bank personal loan applications from early 2026, framed as one question for lenders, vendors, and the marketers who feed them: does the applicant who looks strongest actually convert best? Mostly, no.
Picture the applicant most people in this industry would bet on: High income, prime credit, no outstanding debt, owns a home and comes in asking for a large loan because they can clearly carry it. On paper, that’s the profile you’d build a campaign around and fast-track through underwriting.
However, the data doesn’t agree. When we looked at roughly 500,000 non-bank personal loan applications submitted across Canada in early 2026, the profile that actually reached funding, meaning the completed and accepted loan that pays everyone in the chain, looked different in almost every dimension. The through-line is simple to state and worth sitting with: lenders fund the borrower they can see and trust quickly, not the one who looks most prosperous.
A note on the numbers before the comparisons: these are relative funding patterns from one applicant pool, expressed as an index where a baseline segment is set to 100. A score of 146 means that the group funds 1.46 times as often as the baseline; 58 means a little over half as often. They aren’t absolute funding rates, and they describe our applicants, not a guarantee for any individual. We’re also measuring funded loans rather than approvals, so an applicant who’s approved but walks away counts as a miss. For a lender or a lead buyer, that’s the honest unit anyway.
With that, five rounds. Each one puts the applicant that intuition favours against the one the data favours.
Round one: the big earner vs. the steady earner
Intuition picks the highest income. The data picks the steadiest. How someone earns turns out to matter more than how much they earn: the gap between the best and worst income types (full-time at 146, unemployed at 34) is about 1.3 times wider than the gap between the highest and lowest income levels. Stranger still, for non-traditional earners a bigger reported income can lower funding odds. Unemployed applicants reporting $4,000 to $5,000 a month funded at roughly twice the rate of those reporting $5,000 to $6,000. Without a salaried employer behind it, a large number reads as unverifiable rather than reassuring.
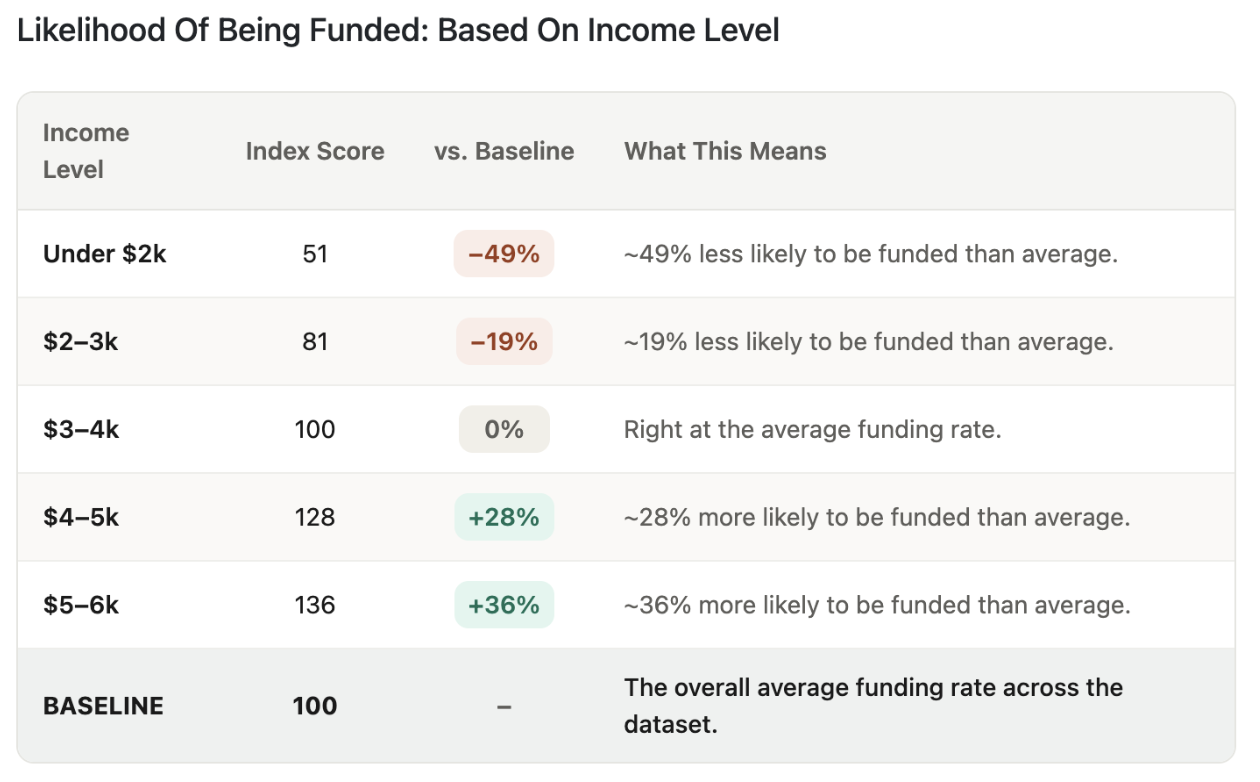
For marketers, that’s a direct cue. Copy that leads with “high income required” filters out convertible applicants and sets the wrong expectation at the top of the funnel. “Steady, regular income” is both truer to what the lender rewards and wider in reach.
Round two: the invisible advantage
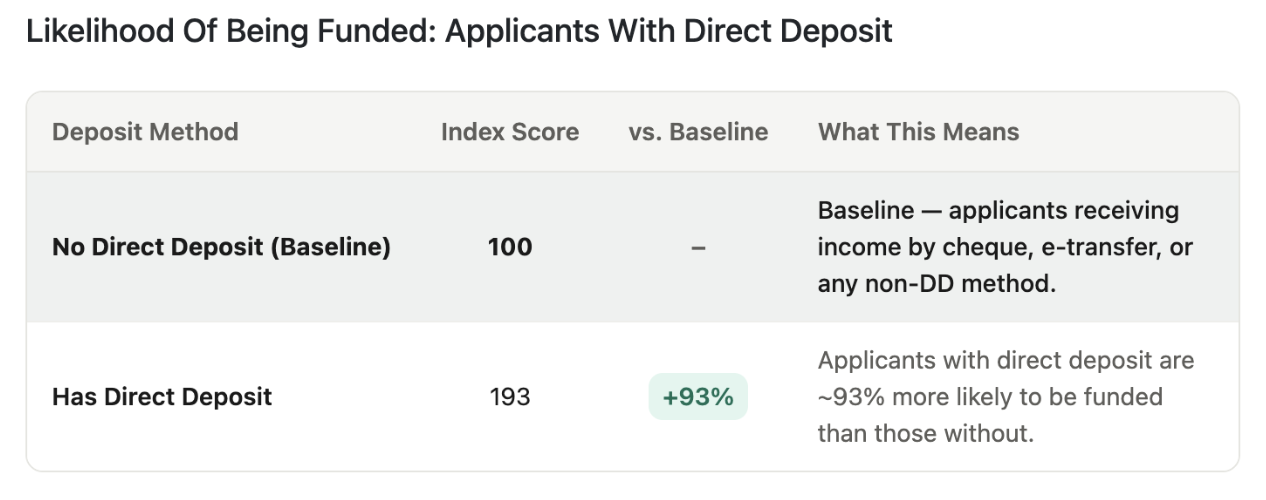
This round has no “looking” pick at all, which is exactly why it’s the most useful. Applicants whose income arrives by direct deposit are funded about 93% more often than those paid by cheque or e-transfer. The lift is largest for the income types most people write off: social security (+641%), disability (+367%), retired (+152%), and unemployed (+148%). Self-employed applicants are the one exception, at +1%, because a deposit you pay yourself isn’t a promise from an independent payer.
Direct deposit is the clearest evidence a lender has that income is real and recurring, which makes this a verification story more than an income story. It’s the same logic behind the move toward cash-flow and bank-verified underwriting: confirm the money at the source and quality rises without chasing volume. It’s also a clean marketing angle, because it’s a behaviour rather than a demographic. “One banking setting that can nearly double your approval odds” is counterintuitive, accurate, and a fast pre-qualifying question to put in a funnel.
Round three: prime vs. fair credit
Intuition picks good credit. In this channel, fair credit beats it. With fair credit set as the baseline (100), good-credit applicants scored 74 and low-credit applicants 58. The likeliest explanation is selection, not borrower quality: people with good credit have options, so they tend to arrive in alternative lending as a fallback or to rate-shop, and they convert worse than their score suggests. Fair-credit borrowers are the core of this market and follow through. The practical read for underwriting is that a prime score in a non-prime channel is a reason to look closer, not a reason to relax.
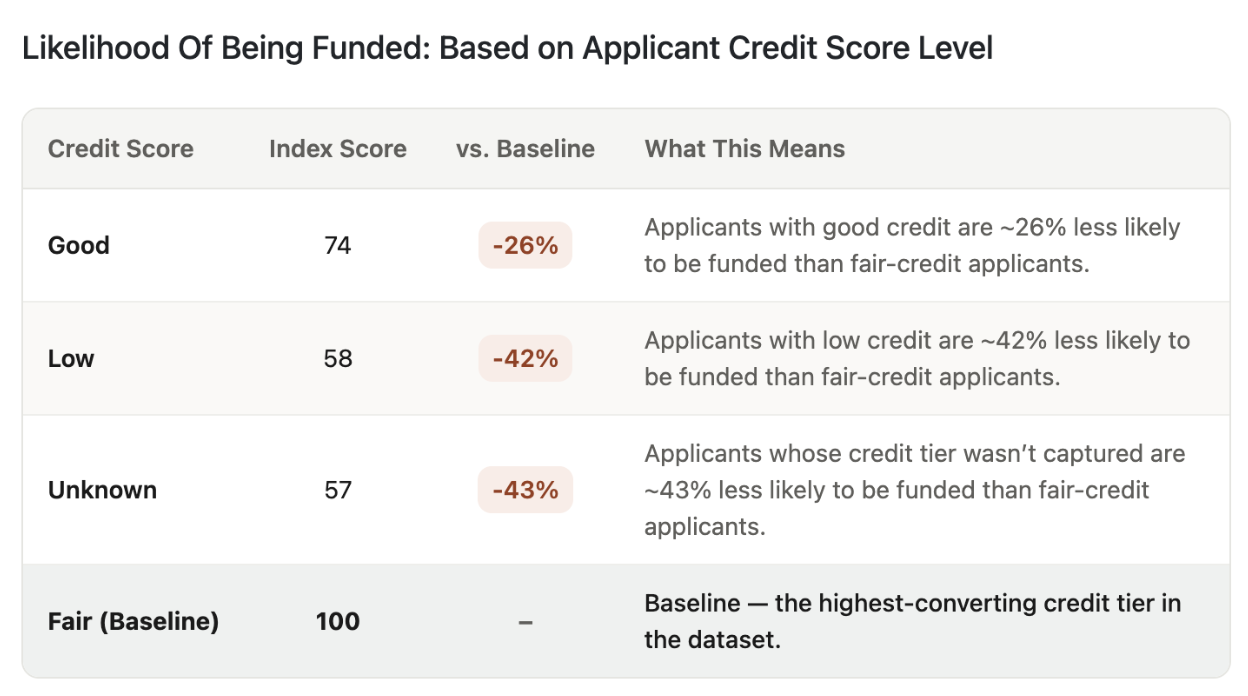
The messaging read matters too. Treating “bad credit” as a disqualifier in your creative screens out an audience that still funds at more than half the top-tier rate. “Bad credit narrows your odds, it doesn’t close the door” keeps that audience engaged with a promise the data actually supports.
Round four: the clean file vs. the active file
Intuition picks the applicant with no debt. The data picks the one with an active, well-managed balance. Applicants carrying no unsecured debt funded well below average (index 51), while those in the $30,000 to $50,000 range peaked at 138. Two things drive it: a blank file is hard to score, and debt-averse applicants are more likely to get approved and then decline the offer. None of this means debt is good, and it’s not a reason to encourage anyone to take on more. It’s a statement about who is legible and who follows through.
This is where a lot of finance marketing quietly works against itself. Messaging built around the never-been-in-debt customer is chasing the segment least likely to convert, while copy that treats existing balances as a red flag scares off the segment most likely to. Debt-consolidation and “already carrying balances” angles do the opposite: they reach borrowers who both need the product and complete the application, and they frame the offer as relevant rather than pushy. A borrower with a few balances to combine isn’t a worse lead. On this evidence, they’re a better one.
Round five: the ask itself
Intuition reads a big loan request as strong intent. The data reads it as friction. Requests funded above average up to about $10,000, peaking in the $5,000 to $10,000 band at +13%, then slid steadily as the amount climbed. The requested amount is one of the few things an applicant declares before any decision is made, it costs nothing to capture, and it predicts funding, which makes it a useful early input for scoring and routing.
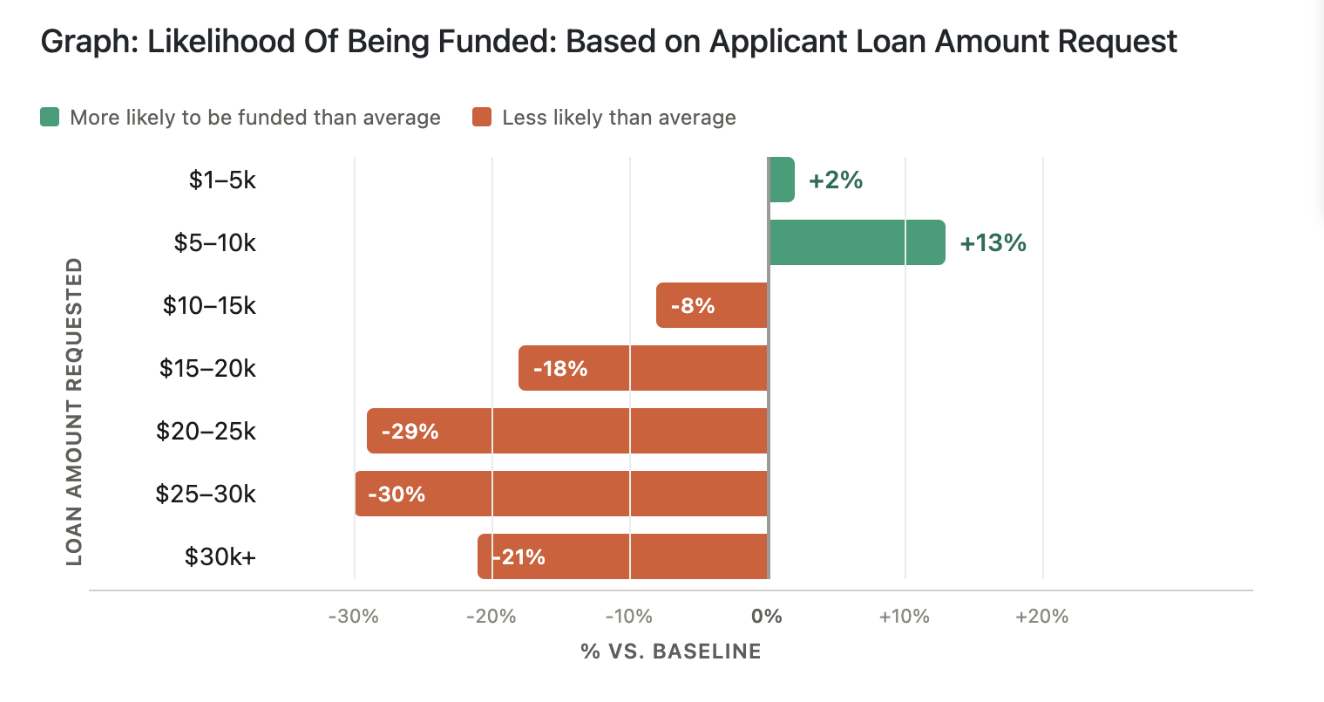
It’s also an underused marketing lever, and the most counterintuitive one for a lender to act on. You might fund up to $50,000, but anchoring your creative on that headline number pulls in larger, lower-converting requests. Promoting the $5,000 to $10,000 range attracts asks that actually fund. Your maximum loan size and your best-performing marketing anchor don’t have to be the same figure, and this data suggests they usually shouldn’t be. The number that wins the click isn’t always the number that funds.
The profile that actually converts
Line the five rounds up and a single picture forms. The borrower who funds has income that’s steady and easy to verify, gets paid by direct deposit, sits in the fair credit band, carries an active and managed credit file, and asks for a moderate amount. Every one of those traits is a legibility trait. None of them is about strength in the impressive sense; all of them are about how quickly and confidently a lender can read the file.
That has a blunt implication for anyone spending to acquire applicants. If prime-looking traffic converts worse, then acquisition optimised toward it is paying a premium for underperformance. The more durable approach, on both the underwriting side and the marketing side, is to optimise toward fundability and let the message attract the legible borrower rather than the flashy one. It’s the same principle behind lead quality beating raw volume, which we’ve written about in more depth on the marketing side of our own operation. The lenders and vendors who internalise it stop paying more for leads that look better and fund worse.
One guardrail before anyone operationalizes this
Several of the highest-signal segments in the study overlap with protected or sensitive characteristics, including age, disability, and source of income. The right use of these findings is to inform underwriting logic, offer relevance, and lead scoring, not to build ad-platform audiences that target or exclude people on those grounds. On Meta and comparable platforms, credit and loan campaigns already fall under Special Ad Category rules that restrict exactly that kind of targeting. The reassuring part is that the strongest, cleanest levers here are behavioural rather than demographic: payment method, requested amount, self-reported credit band, and debt situation. That’s where both the compliance footing and the conversion lift are best.
The pattern that holds
The applicant a lender can quickly understand beats the applicant who merely looks impressive, in the data and, if you follow it through, in how you market. Predictability outperforms prosperity at almost every step of this funnel. Loans Canada has operated in that non-bank channel long enough to watch the pattern hold across millions of applications, and the practical lesson for lenders, vendors, and marketers is the same one: build for the borrower you can read, and stop overpaying for the one who only looks the part.
Figures reflect relative funding likelihood across roughly 500,000 Loans Canada applications in early 2026. They describe patterns in one applicant pool, not guaranteed outcomes, absolute approval rates, or lending decisions for any individual.















 Event Insights